The 2024 Economic Report on U.S. Pharmacies and Pharmacy Benefit Managers
 The 2024 Economic Report on U.S. Pharmacies and Pharmacy Benefit Managers
by Adam J. Fein, Ph.D.
(529 page downloadable PDF file; Released March 2024)
Corporate License + PowerPoint file with Exhibits: $14,800 BUY
(Allows for use of the report by an unlimited number of employees within the same organization or enterprise worldwide. Includes an additional PowerPoint file with all 262 exhibits that are included in the report. The exhibits appear in all license versions. Link to download sent immediately upon purchase. View License Terms.)
Corporate License: $13,700 BUY
(Allows for use of the report by an unlimited number of employees within the same organization or enterprise worldwide. Link to download sent immediately upon purchase. View License Terms.)
Department/Team License: $9,700 BUY
(Allows for use of the report by 2 to 10 employees within the same organization or enterprise. Link to download sent immediately upon purchase. View License Terms.)
Single-User License: $1,900 REQUEST
(Allows for use of the report by one individual person. View License Terms. Drug Channels Institute (DCI) must approve all single-user license purchases before download. We do not permit the purchase of a single user license by individuals working at investment/financial firms, multi-person consulting firms, publicly traded companies, and any organization with more than 10 employees. Ineligible purchases will be promptly refunded.)
Purchasing Information
- Payment can be made with all major credit cards (Visa, MasterCard, American Express, and Discover) or via PayPal. Click here to contact us if you would like to pay by corporate check or ACH.
- License terms, purchaser’s name/email, and a unique transaction ID will be added to the secure PDF file upon checkout. All sales are final after download.
- Drug Channels Institute (DCI) must approve all single-user license purchases after purchase but before download. We do not permit the purchase of a single user license by individuals working at investment/financial firms, multi-person consulting firms, publicly traded companies, and any organization with more than five employees. If your purchase is approved, then you will receive an email with a link to download the report. If you are not eligible for a single user license, DCI will promptly refund your purchase to the original form of payment. DCI reserves the right to reject any purchase, and it is under no obligation to explain individual decisions.
- Click here to email us if you would like to upgrade the license of a report that you already purchased. You will pay only the difference in license fee. Please respect our license terms.
- ALL SALES ARE FINAL AFTER DOWNLOAD. If you have purchased a report in error, please contact us BEFORE downloading.
The 2024 Economic Report on U.S. Pharmacies and Pharmacy Benefit Managers remains the most comprehensive, fact-based tool for understanding the entire U.S. drug pricing, reimbursement, and dispensing system.
It’s your ultimate guide to the complex web of interactions within U.S. prescription drug channels. This unique, encyclopedic resource will benefit pharmaceutical manufacturers, wholesalers, pharmacists, pharmacy owners, hospitals, buyers, benefit managers, managed care executives, policy analysts, investors, consultants—anyone who wants to understand and benefit from this ever-changing industry.
The report was researched and written by Adam J. Fein, Ph.D., one of the world’s leading experts on the industry and author of the influential Drug Channels website. It synthesizes a wealth of statistical data, research studies, financial information, and his unique business consulting experience into a definitive, nonpartisan resource. This new 14th edition integrates information about pharmacy dispensing channels, third-party payers, pharmacy benefit managers (PBMs), patients’ financial contributions, government regulations, and wholesalers.
The 2024 Economic Report on U.S. Pharmacies and Pharmacy Benefit Managers retains the overall structure of last year’s edition. As always, we have updated all market and industry data with the most current information available, including our annual analyses of the market positions of the largest pharmacies, specialty pharmacies, and PBMs. Throughout the report, we have added new industry data, deepened our coverage of many topics, and added more trending information.
The notable new material in this 2024 edition includes the following:
- Section 4.3. has new explanatory material to better cover the economics behind the growing market for patient-paid prescriptions—cash-pay prescriptions and discount cards. We have also updated Section 12.4.3., which reviews how and why plan sponsors are incorporating these programs within pharmacy benefits.
- Section 5.1.4. and Section 12.2.2. contain new analyses of the market dynamics for Humira biosimilars.
- Section 6.2. has been reorganized and contains an expanded presentation of material related to plan sponsors’ use of such benefit design tools as copay accumulator adjustment, copay maximizers, and alternative funding programs.
- Section 7.3.2. now integrates material related to specialty pharmacies’ role in the gene therapy market. Since these therapies are typically covered by patients’ medical benefits, we have shifted more detailed coverage to our companion Economic Report on Pharmaceutical Wholesalers and Specialty Distributors.
- Section 8.4. has been reorganized into two new subsections to address developments in acquisition cost reimbursement for prescriptions. Section 8.4.1. updates our analysis of fee-for-service Medicaid programs, while Section 8.4.2. focuses on cost-based models by commercial payers and cash-pay pharmacies.
- Section 9.1.1. contains new analyses of PBMs’ state-mandated disclosures on rebates.
- Section 9.1.2. and Section 11.4. include new data and updated estimates for manufacturers’ and pharmacies’ Part D liabilities, including direct and indirect remuneration (DIR) payments and coverage gap discounts.
- Section 12.2.3. includes expanded data and analyses of nonbiological generic specialty drugs, given the importance of these products for such cash-pay pharmacies as the Mark Cuban Cost Plus Drug Company.
- A new Section 12.3.4. analyzes how acquisition cost reimbursement could impact pharmacy profitability and the overall industry.
- We have added significant new material to the sections introduced in the 2023 edition of this report that discuss the Inflation Reduction Act of 2022. These include Section 12.5.1., which summarizes the key provisions of the law and current guidance, and Section 12.5.2., which highlights potential implications of the IRA for the drug channel.
- There are 262 exhibits in the 2024 edition, compared with 241 in the 2023 edition.
Download a free report overview for complete details.
The chart below illustrates the depth and breadth of the 2024 edition. The numbers indicate the report chapter that corresponds to, explains, and analyzes each channel flow.
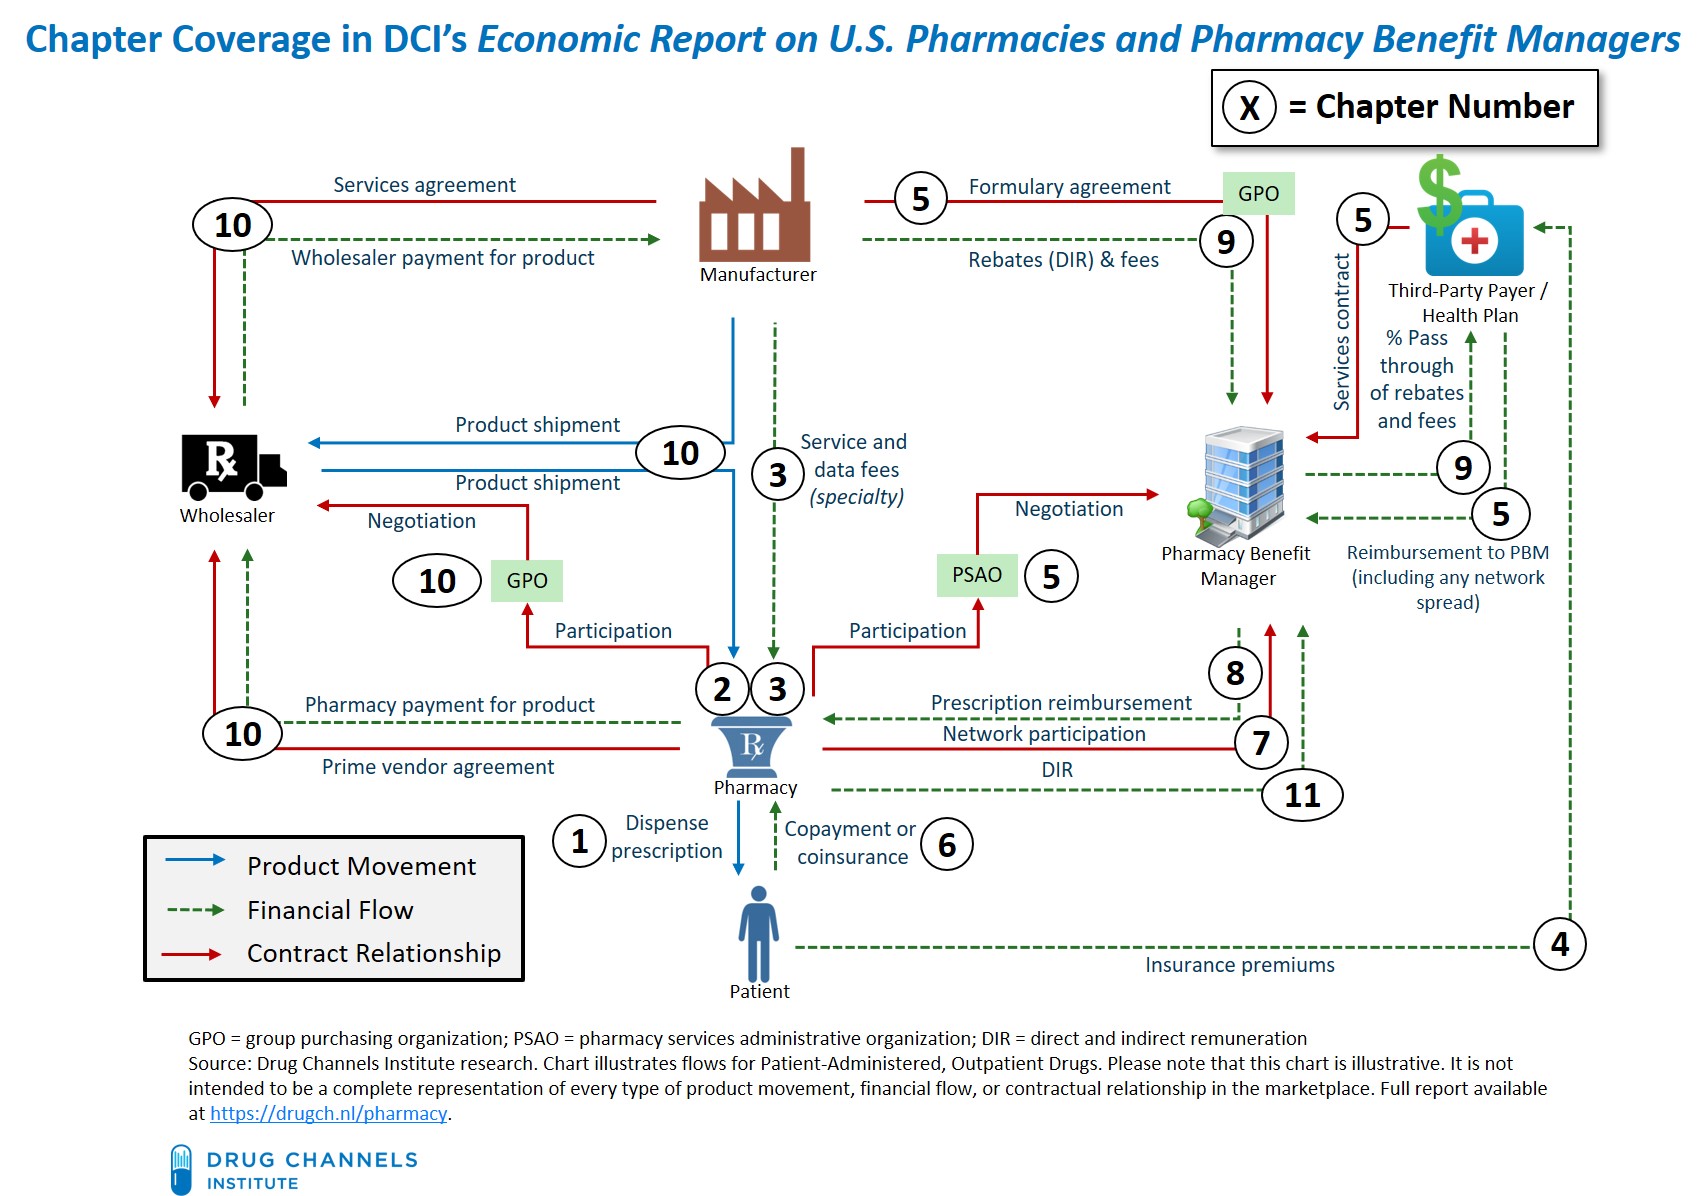
The chapters are self-contained and do not need to be read in order. We include extensive internal references to help you navigate the entire document and customize it to your specific needs. (These references are clickable hyperlinks in the PDF document.) There are also more than 1,000 endnotes, most of which have hyperlinks to original source materials.
Please note that purchase of The 2024 Economic Report U.S. Pharmacies and Pharmacy Benefit Managers indicates agreement with the terms and conditions of the End User License Agreement (EULA). License terms, purchaser’s name/email, and a unique transaction ID will be added to the secure PDF file upon checkout. You must purchase a Department/Team or Corporate License if you want to share the report with other people in your company. Upon request, we will refund duplicate purchases of a Corporate License from the same organization.
LICENSE TERMS
THIS END USER LICENSE AGREEMENT (“Agreement”) governs your use of The 2024 Economic Report on U.S. Pharmacies and Pharmacy Benefit Managers (“Report”) provided by HMP Omnimedia, LLC, an HMP Global Company, d/b/a Drug Channels Institute, (“DCI”) under this Agreement made available to, or accessed by, you (“Purchaser”). Purchaser may cite this Report in commercial documents with full and appropriate attribution. Nothing in the license is intended to reduce, limit, or restrict any rights arising from fair use under copyright law or other applicable laws. License terms, purchaser’s name/email, and a unique transaction ID will be added to the secure PDF file upon checkout. We offer three License Options:
- Single User License: This license allows for use of the Report by one individual person. This person may use the Report on any computer, and may print out the Report, but may not share the Report with any other person or persons. DCI does not permit the purchase of a single user license by individuals working at investment/financial firms, multi-person consulting firms, publicly traded companies, and any organization with more than 10 (ten) employees. Purchasers who violate this limitation are liable for a Department/Team or Corporate License fee.
- Department/Team License: This license allows for use of the Report by 2 (two) to 10 (ten) employees within the same organization or enterprise as the purchaser identified in the upper left corner of this page. Each of these employees may use the Report on any computer, and may print out the Report, but may not share the Report with any other person or persons unless a Corporate License is purchased. Purchasers violate this limitation are liable for a Corporate License fee.
- Corporate License: This license allows for use of the Report by an unlimited number of employees within the same organization or enterprise worldwide as the purchaser identified in the upper left corner of this page. Each of the employees within this organization or enterprise may use the Report on any computer, and may print out the Report, but may not share the Report with any other person or persons outside the enterprise or organization.
The 2024 Economic Report on U.S. Pharmacies and Pharmacy Benefits Managers is protected by copyright law. Unauthorized reproduction or distribution of this report, or any portion of it, may result in severe civil and criminal penalties, and will be prosecuted to the maximum extent of the law. This report may be cited in commercial documents with full and appropriate attribution. Nothing in this license is intended to reduce, limit, or restrict any rights arising from fair use under copyright law or other applicable laws.
TABLE OF CONTENTS
Introduction and Guide to This Report
PREFACE: INDUSTRY TRENDS AND KEY REPORT THEMES
SECTION I: THE U.S. PHARMACY INDUSTRY
Chapter 1: Industry Overview
- 1.1. Pharmacy Fundamentals
- 1.1.1. Defining the Practice of Pharmacy
- 1.1.2. Pharmacies and the Drug Supply Chain Security Act
- 1.2. The Products That Pharmacies Dispense
- 1.2.1. Brand vs. Generic Drugs
- 1.2.2. Traditional vs. Specialty Drugs
- 1.2.3. Top Therapy Classes and Average Prescription Costs
- 1.3. Pharmacy Industry Participants
- 1.3.1. Pharmacy Dispensing Formats
- 1.3.2. Differences Among Outpatient Retail Dispensing Formats
- 1.3.3. Pharmacist Salaries and Employment
- 1.4. Healthcare and Clinical Services
- 1.4.1. Retail Healthcare and Provider Services
- 1.4.2. Medication Therapy Management (MTM), Clinical Services, and Provider Status
- 1.4.3. Immunization and Vaccination
- 1.4.4. Administration and Pharmacy Economics of COVID-19 Vaccines
Chapter 2: Pharmacy Industry Market Structure
- 2.1. Industry Trends
- 2.1.1. Total and 30-Day Equivalent Prescriptions
- 2.1.2. Prescription Dispensing Revenues
- 2.2. National Prescription Dispensing Market Share by Company
- 2.3. Trends by Dispensing Format
- 2.3.1. Long-Term Trends in Revenues and Prescriptions
- 2.3.2. Market Changes in 2023
- 2.3.3. National Retail Chains
- 2.3.4. Regional Chains
- 2.3.5. Independent Pharmacies
- 2.3.6. Mail Pharmacies
Chapter 3: Specialty Drugs and Specialty Pharmacies
- 3.1. Specialty Pharmacies
- 3.1.1. Defining Specialty Pharmacy
- 3.1.2. Clinical and Data Services
- 3.1.3. Accreditation
- 3.2. Specialty Pharmacy Market Structure
- 3.2.1. Specialty Pharmacy Industry Market Size
- 3.2.2. Number of Accredited Specialty Pharmacies
- 3.2.3. National Market Share for Specialty Dispensing, by Company
- 3.2.4. Mergers and Acquisitions Among Specialty Pharmacies in 2022
- 3.3. Trends by Specialty Dispensing Format
- 3.3.1. Overview of the 2023 Marketplace
- 3.3.2. Pharmacy Benefit Managers and Health Plans
- 3.3.3. Independent Specialty Pharmacies
- 3.3.4. Retail Chains
- 3.3.5. Hospitals and Health Systems
- 3.3.6. Physician Practices
- 3.3.7. Pharmaceutical Wholesalers
- 3.4. Manufacturer Channel Strategies for Specialty Drugs
- 3.4.1. Manufacturer-Defined Dispensing Networks and REMS
- 3.4.2. Compensation for Specialty Pharmacy Clinical and Data Services
- 3.4.3. Specialty Hub Services and Leading Providers
SECTION II: THIRD-PARTY PAYMENT AND PHARMACY BENEFITS
Chapter 4: Payment and Spending for Prescription Drugs
- 4.1. U.S. Healthcare Spending
- 4.1.1. Enrollment in Health Insurance and COVID-19 Impact
- 4.1.2. Prescription Drugs and U.S. Healthcare Spending
- 4.2. Payer and Spending Trends
- 4.2.1. Payment for Outpatient Prescription Drugs
- 4.2.2. Trends in Drug Spending, by Payer
- 4.2.3. Trends in Drug Spending: Traditional vs. Specialty
- 4.2.4. Deconstructing Changes in Cost vs. Utilization
- 4.3. Patient-Paid Prescriptions
- 4.3.1. Cash-Pay Prescriptions and Usual & Customary Pricing
- 4.3.2. Discount Card Programs
Chapter 5: Pharmacy Benefit Management
- 5.1. Overview of Pharmacy Benefit Management
- 5.1.1. Services for Plan Sponsors
- 5.1.2. Relationships with Plan Sponsors
- 5.1.3. Formulary Development and Management
- 5.1.4. Formulary Exclusions
- 5.1.5. Utilization Management
- 5.2. PBM Industry Structure
- 5.2.1. National Market Share, by PBM
- 5.2.2. Business Trends for the Largest PBMs
- 5.2.3. Smaller PBMs
- 5.2.2. PBM Purchasing Groups and GPOs
- 5.3. Relationships Between PBMs and Pharmacies
- 5.3.1. Pharmacy Participation in PBM Networks
- 5.3.2. PBM-Pharmacy Negotiations
- 5.3.3. Pharmacy Services Administrative Organizations (PSAOs)
- 5.4. PBM Compensation by Plan Sponsors
- 5.4.1. Spread Pricing
- 5.4.2. Pass-Through Pricing
Chapter 6: Consumer Copayments and Coinsurance
- 6.1. Cost Sharing in Pharmacy Benefit Design
- 6.1.1. Employer-Sponsored Health Plans
- 6.1.2. Health Insurance Marketplace Plans
- 6.1.3. Medicare Part D
- 6.1.4. Medicaid
- 6.2. Manufacturer Out-of-Pocket Payment Support
- 6.2.1. Copayment Offset Programs and Patient Assistance Programs
- 6.2.2. Copay Accumulator Adjustment and Copay Maximizers
- 6.2.3. Alternative Funding Programs
- 6.3. Out-of-Pocket Expenses
- 6.3.1. Actual Patient Out-of-Pocket Spending on Prescriptions
- 6.3.2. Consequences of Pharmacy Benefit Designs
Chapter 7: Narrow Pharmacy Networks
- 7.1. Overview of Pharmacy Benefit Network Models
- 7.1.1. Network Options
- 7.1.2. The Economics of Narrow Pharmacy Networks
- 7.1.3. Legal and Regulatory Restrictions on Network Design
- 7.2. Retail Pharmacy Networks
- 7.2.1. Preferred Retail Networks in Medicare Part D
- 7.2.2. Narrow Retail Networks in Commercial and Other Plans
- 7.2.3. Narrow Networks for Maintenance Prescriptions
- 7.3. Payer-Defined Specialty Dispensing Networks
- 7.3.1. Commercial Health Plans
- 7.3.2. Specialty Pharmacies’ Role in Buy-and-Bill Channels
SECTION III: DRUG CHANNEL ECONOMICS AND OUTLOOK
Chapter 8: Prescription Reimbursement by Third-Party Payers
- 8.1. The Basics of Prescription Reimbursement
- 8.1.1. Estimated Acquisition Cost (EAC)
- 8.1.2. Dispensing Fees
- 8.1.3. Service and Data Fees
- 8.2. Reimbursement for Brand-Name and Specialty Prescriptions
- 8.2.1. Wholesale Acquisition Cost (WAC) and Average Wholesale Price (AWP) List Prices
- 8.2.2. AWP Discounts for Pharmacy Reimbursement in 2023
- 8.2.3. Why Mail Pharmacies Accept Lower Reimbursements
- 8.3. Reimbursement for Generic Prescriptions
- 8.3.1. AWP Discounts for Generic Prescriptions in 2023
- 8.3.2. Maximum Allowable Cost (MAC) Limits and Generic Effective Rates (GER)
- 8.3.3. Regulations and Laws Regarding MAC Limits
- 8.3.4. Medicaid and Federal Upper Limits
- 8.4. Acquisition Cost Reimbursement
- 8.4.1. Fee-for-Service Medicaid
- 8.4.2. Commercial Payer and Cash-Pay Pharmacies
Chapter 9: Drug Pricing, Rebates, and Payer Costs
- 9.1. Rebates to Third-Party Payers
- 9.1.1. How Commercial Payers Access Rebates
- 9.1.2. Rebates, DIR, and Coverage Gap Discounts in Medicare Part D
- 9.1.3. The Medicaid Drug Rebate Program
- 9.1.4. Department of Veterans Affairs
- 9.2. Gross and Net Drug Pricing
- 9.2.1. List vs. Net Drug Prices
- 9.2.2. The Gross-to-Net Bubble in 2023
- 9.3. Issues with the Rebate System
- 9.3.1. How Plan Sponsors Use Rebates
- 9.3.2. Point-of-Sale (POS) Rebates
- 9.3.2. Controversies Over Rebates and Rebate Reform
- 9.4. How Prescription Reimbursement, Formulary Rebates, Consumer Copayments, and PBM Expenses Affect Plan Sponsor Costs
Chapter 10: Relationships With Pharmaceutical Wholesalers
- 10.1. Overview of Wholesale Drug Channels
- 10.1.1. Industry Participants
- 10.1.2. Product Distribution
- 10.1.3. Financial Intermediation
- 10.1.4. Other Services for Pharmacies, Providers, and Manufacturers
- 10.1.5. Influence on Pharmacy Reimbursement
- 10.2. Determinants of Pharmacies’ Acquisition Costs
- 10.2.1. Wholesaler Pricing of Brand-Name Drugs to Pharmacies
- 10.2.2. Pharmacy Group Purchasing Organizations
- 10.2.3. Generic Sourcing Relationships Between Wholesalers and Large Pharmacies
Chapter 11: Pharmacy and Prescription Profitability
- 11.1. Overall Drugstore Gross Margins
- 11.1.1. Industry Averages
- 11.1.2. Chain Drugstores
- 11.2. Pharmacy Per-Prescription Profits
- 11.2.1. Sources of Per-Prescription Profits
- 11.2.2. Average Per-Prescription Profits for Pharmacies
- 11.2.3. PBM Gross Profits from Network and PBM-Owned Pharmacies
- 11.2.4. The Impact of Brand-Name Inflation on Prescription Profits
- 11.3. Lifecycle Profitability for Generic Prescriptions
- 11.4. Pharmacy DIR Fees in Medicare Part D Networks
- 11.4.1. Computation of Pharmacy DIR Fees
- 11.4.2. Financial Impact of Pharmacy DIR Fees
- 11.4.3. The Current Status and Future for Pharmacy DIR Fees
- 11.5. Pharmacy Profits from the 340B Drug Pricing Program
- 11.5.1. Overview of the 340B Program and Drug Prices
- 11.5.2. Companies Participating as 340B Contract Pharmacies
- 11.5.3. Flow of Funds For a 340B Contract Pharmacy Network
- 11.5.4. Third-Party Administrators of 340B Contract Pharmacy Services
- 11.5.5. Pharmacy and Covered Entity Profits from 340B Prescriptions
Chapter 12: Outlook and Emerging Trends
- 12.1. Drug Prices
- 12.1.1. The Outlook for Brand-Name Drug Prices
- 12.1.2. The Outlook for Generic Drug Prices
- 12.1.3. Payment for Outpatient Prescription Drugs in 2028
- 12.2. The Outlook for Specialty Drugs
- 12.2.1. 2023 Update on the Biosimilar Market
- 12.2.2. Biosimilars Under the Pharmacy Benefit
- 12.2.3. The Growth of Specialty Generic Drugs
- 12.2.4. The Outlook for Pharmacy Revenues to 2028
- 12.3. Emerging Trends
- 12.3.1. Vertical Integration of Insurers, PBMs, Specialty Pharmacies, and Providers
- 12.3.2. Importation from Canada
- 12.3.3. State Legislation of the Drug Channel
- 12.3.4. implications of Acquisition Cost Reimbursement for Pharmacies
- 12.3.5. Controversy Over 340B Contract Pharmacies
- 12.3.6. Shakeout and Consolidation in Retail Pharmacy
- 12.4. New Entrants and Potential Pharmacy Market Disruption
- 12.4.1. Update on Amazon’s Pharmacy Strategy
- 12.4.2. Venture-Backed Digital Pharmacies
- 12.4.3. Patient-Paid Prescriptions within Pharmacy Benefits
- 12.5. The Inflation Reduction Act of 2022
- 12.5.1. Key Provisions of the IRA for Medicare Part D
- 12.5.2. Drug Channels Implications of the IRA
Acronyms and Abbreviations
Endnotes
LIST OF EXHIBITS
Major Public Companies Operating in U.S. Drug Channels
The U.S. Pharmacy Distribution and Reimbursement System for Patient-Administered, Outpatient Brand-Name Drugs
Exhibit 1: Timeline of DSCSA Requirements for Pharmacies (Dispensers), 2013 to 2024
Exhibit 2: Unbranded and Branded Generics, Share of U.S. Prescriptions, 2003 to 2023
Exhibit 3: Variation in State Generic Substitution Policies
Exhibit 4: Dispense As Written (DAW) Product Selection Codes
Exhibit 5: Top Traditional Therapy Categories, Generic Drugs as a Share of Prescriptions and Spending, 2023
Exhibit 6: Specialty Prescriptions, Number and Share of Total, 2018 to 2023
Exhibit 7: Specialty Drugs as a Share of Net Spending, by Therapeutic Class, 2020
Exhibit 8: Formulary Agreement on Specialty Drug Classification, by PBM, 2023
Exhibit 9: Top Therapy Categories, Share of Non-Discounted Purchases and Average Brand-Name and Generic Prescription Costs, 2023
Exhibit 10: Average Annual Number of Prescriptions per Pharmacy, by Retail Dispensing Format, 2023
Exhibit 11: Average Wait Time for Prescription Pickup, by Retail Dispensing Format, 2020
Exhibit 12: Average Annual Prescription Revenue per Pharmacy Outlet, by Retail Dispensing Format, 2023
Exhibit 13: Top Four Reasons for Pharmacy Selection, by Dispensing Format
Exhibit 14: Average Number of Retail Pharmacies per County, by Dispensing Format and Degree of Urbanization, 2020
Exhibit 15: Pharmacist Work Activities, by Practice Setting, 2022
Exhibit 16: Customer Satisfaction with Pharmacies, by Dispensing Format and Company, 2023
Exhibit 17: Pharmacist Employment and Salary, by Practice Setting, 2022
Exhibit 18: Share of Pharmacist Employment, by Industry, 2013 to 2032
Exhibit 19: Pharmacists and Healthcare Workers, Change in Annual Average Salary, by Employer, 2014 to 2022
Exhibit 20: Coverage for Retail Clinics by Employer-Sponsored Plans, 2010 to 2023
Exhibit 21: Providers of Medication Therapy Management Services, Medicare Part D
Exhibit 22: Completion Rate of Medication Therapy Management Services, Medicare Part D, by Plan Type, 2021 to 2023
Exhibit 23: Current Procedural Terminology (CPT) Codes Used by Pharmacists
Exhibit 24: Consumers’ Level of Trust in Pharmacists to Perform Various Healthcare Services, 2021
Exhibit 25: CPESN Networks and Pharmacies, 2018 to 2023
Exhibit 26: Adult Influenza Vaccines Administered, Pharmacies vs. Physician Offices, 2019–20 to 2023–24 Seasons
Exhibit 27: Share of COVID-19 Vaccine Doses Administered at Retail Pharmacies, by Company, 2021 to 2023
Exhibit 28: Total U.S. Pharmacy Industry Prescription Revenues, Prescriptions, and Locations, by Dispensing Format, 2023
Exhibit 29: Prescriptions, Annual Total and Growth, 2019 to 2023
Exhibit 30: 30-Day Equivalent Prescriptions, Annual Total and Growth, 2019 to 2023
Exhibit 31: 90-Day Prescriptions as a Percentage of Total Prescriptions, by Dispensing Format, 2017 to 2023
Exhibit 32: Pharmacy Industry Prescription Revenues, Annual Total and Growth, 2019 to 2023
Exhibit 33: Largest 15 U.S. Pharmacies, by Total Prescription Revenues, 2023
Exhibit 34: Total Change in 30-Day Equivalent Prescriptions Dispensed and Prescription Revenues, by Pharmacy Type, 2013 vs. 2023
Exhibit 35: 30-Day Equivalent Prescriptions Dispensed per Location, by Dispensing Format, 2010 to 2023
Exhibit 36: Number of 30-Day Equivalent Prescriptions, by Dispensing Format, 2022 vs. 2023
Exhibit 37: Prescription Dispensing Revenues, by Dispensing Format, 2022 vs. 2023
Exhibit 38: Year-over-Year Change in Same-Store Prescription Count, by Chain, 2019 to 2023
Exhibit 39: Largest Regional Chain Drugstores, by Total Prescription Revenues, 2023
Exhibit 40: Number of Independent Pharmacies, 2001 to 2023
Exhibit 41: Wholesaler-Owned Pharmacy Franchise and Marketing Groups, 2023
Exhibit 42: U.S. Pharmacy Franchise Locations, by Company, 2015 to 2023
Exhibit 43: Customer Satisfaction with Mail Pharmacies, by Company, 2023
Exhibit 44: Share of Mail Pharmacy Dispensing Revenues, by Company, 2023
Exhibit 45: Importance of Specialty Pharmacy Services to Patients, 2020
Exhibit 46: Specialty Prescription Dispensing Revenues, Annual Total and Growth, 2019 to 2023
Exhibit 47: Specialty Prescription Dispensing Revenues as a Percentage of Total, 2013 to 2023
Exhibit 48: Specialty Drugs as a Percentage of Payers’ Pharmacy Benefit Spending, by PBM, 2021 vs. 2022
Exhibit 49: Number of Pharmacy Locations with Specialty Pharmacy Accreditation, by Organization, 2015 to 2023
Exhibit 50: Locations with URAC Specialty Pharmacy Accreditation, 2008 to 2023
Exhibit 51: Prescription Revenues and Market Share from Specialty Pharmaceuticals, by Company, 2023
Exhibit 52: Merger and Acquisition Transactions, Specialty Pharmacy and Infusion Services, 2014 to 2023
Exhibit 53: Pharmacy Locations with Specialty Pharmacy Accreditation, by Corporate Ownership, 2023
Exhibit 54: Specialty Drug Prescription Revenues, by Dispensing Format, 2023
Exhibit 55: Number of Private Specialty Pharmacy and Infusion Companies Ranked on Inc. 5000 List, 2012 to 2023
Exhibit 56: Retail Companies with Specialty Pharmacy Businesses, 2023
Exhibit 57: Hospitals with a Specialty Pharmacy, by Number of Staffed Beds, 2015 to 2023E
Exhibit 58: Hospital and Clinic Share of Oral Oncology Market, 2017 to 2023
Exhibit 59: Hospitals’ Perceived Barriers to Accessing Specialty Pharmacy Networks, 2020 vs. 2022
Exhibit 60: Physician Employment, by Practice Ownership, 2012 vs. 2022
Exhibit 61: Share of Oncologists in Practices with Medically Integrated Dispensing, by Practice Setting, 2010 to 2022
Exhibit 62: Specialty Pharmacy Network Size, by Number of Pharmacies, 2024
Exhibit 63: Specialty Pharmacy Networks, Participation Rate by Company, 2024
Exhibit 64: Participation in Exclusive Specialty Pharmacy Networks, by Company, 2024
Exhibit 65: Frequency of Manufacturer Contracting for Specialty Pharmacy Services, by Type of Service
Exhibit 66: Example of Specialty Hub Workflow
Exhibit 67: Leading Specialty Hub Services Providers and Ownership, 2023
Exhibit 68: Chapter Coverage of Flows in the U.S. Distribution and Reimbursement System
Exhibit 69: Comprehensive Health Insurance Enrollment, by Payer, 2020 to 2022
Exhibit 70: Medicaid Enrollment, 2005 to 2024E
Exhibit 71: Change in Membership, Commercial vs. Managed Medicaid vs. Medicare Advantage, by Company, Dec. 2019 to Dec. 2023
Exhibit 72: Share of U.S. National Health Expenditures, by Category, 2022
Exhibit 73: Share of U.S. National Health Expenditures, by Major Spending Category, 1982 to 2022
Exhibit 74: Growth Rate in U.S. National Health Expenditures, by Major Spending Category, 2010 to 2022
Exhibit 75: Outpatient Prescription Drug Expenditures, by Source of Payment, 2022
Exhibit 76: Outpatient Prescription Drugs as a Share of Payer’s Total Health Expenditures, by Payer, 2005 to 2022
Exhibit 77: Share of Outpatient Prescription Drug Dispensing, by Source of Payment, 2022
Exhibit 78: Prescription Expenses per Person, by Age, 2021
Exhibit 79: Prescription Drug Utilization Among Seniors, 1988 to 2018
Exhibit 80: Change in Net Spending for Outpatient Prescription Drugs, by Payer, 2021 vs. 2022
Exhibit 81: Total Expenditures and Consumer Out-of-Pocket Spending for Hospital Care vs. Prescription Drugs, 2022
Exhibit 82: Change in Commercial Payer Net Drug Spending, Traditional vs. Specialty Drugs, 2014 to 2022
Exhibit 83: Change in Commercial Payer Net Drug Spending, Traditional vs. Specialty Drugs, by PBM, 2022
Exhibit 84: Components of Change in Outpatient Prescription Drug Spending, 2018 to 2022
Exhibit 85: Components of Change in Commercial Payer Net Specialty Drug Spending, by PBM, 2022
Exhibit 86: Cash-Pay Prescriptions as a Share of Total Prescriptions, 2017 to 2023
Exhibit 87: Usual & Customary Cash Prescription Prices vs. Pharmacy Acquisition Costs, Generic and Brand-Name Drugs, 2014 vs. 2019
Exhibit 88: Cash-Pay Pharmacies, Estimates of Total Prescription Savings vs. Medicare Part D, 2017 to 2022
Exhibit 89: Discount Card Claims as Share of Total Equivalent Prescriptions, by Vendor, 2017 to 2023
Exhibit 90: Share of Discount Card Claims vs. Overall Prescription Share, by Dispensing Format, 2023
Exhibit 91: Pharmacy Distribution and Reimbursement System for Outpatient Generic Drugs with a Discount Card
Exhibit 92: Prescription Economics with a Discount Card—Traditional Generic Drug Example
Exhibit 93: Share of Patients with One or More Discount Card Adjudications, 2021
Exhibit 94: GoodRx, Prescription Revenues and Consumer Out-of-Pocket Cost, 2016 to 2023
Exhibit 95: Pharmacy Benefit Management Contracting Approach, by Company Size, 2023E
Exhibit 96: Adoption of PBM National Formulary, by Type of Plan Sponsor, 2023
Exhibit 97: Number of Unique Products on PBM Formulary Exclusion Lists, Single-Source vs. Multiple-Source, 2014 to 2022
Exhibit 98: Number of Products on PBM Formulary Exclusion Lists, by PBM, 2012 to 2024
Exhibit 99: Formulary Coverage for Humira and Its Biosimilars, by PBM, 2024
Exhibit 100: Prevalence of Utilization Management Tools, Commercial Plan Sponsors, 2014 vs. 2023
Exhibit 101: Use of Prior Authorization and Step Therapy for Single-Source Brand-Name Drugs, by Therapeutic Class, 2020
Exhibit 102: Prevalence of Utilization Management Tools, Medicare Part D Plans, 2023
Exhibit 103: Prevalence of Utilization Management Tools, by Type of Oncology Drug, Medicare Part D Plans, 2020
Exhibit 104: PBM Market Share, by Total Equivalent Prescription Claims Managed, 2023
Exhibit 105: Express Scripts, Quarterly Prescription Claims, by Channel, 2019 to 2023
Exhibit 106: Plan Sponsors’ Satisfaction with PBM Transparency, by PBM Size, 2023
Exhibit 107: PBM-Owned Purchasing Groups and Participation, 2024
Exhibit 108: Largest Pharmacy Services Administrative Organizations, by Membership and Ownership, 2023
Exhibit 109: Key Components of PBM Compensation
Exhibit 110: Share of Employers Using Retail Pharmacy Network Spread Pricing in PBM Contracts, 2015 to 2023
Exhibit 111: Average PBM Network Spread in Medicaid Managed Care, by State, 2018 to 2019
Exhibit 112: Imatinib Mesylate, Fee-for-Service and Managed Medicaid Payments vs. Pharmacy Acquisition Cost, 2017 to 2023
Exhibit 113: Common Pharmacy Benefit Plan Designs
Exhibit 114: Share of Employees Covered by a High-Deductible Health Plan, 2006 to 2023
Exhibit 115: Distribution of Cost Sharing Formulas for Prescription Drug Benefits in Employer-Sponsored Plans, by Plan Type, 2023
Exhibit 116: Type of Cost Sharing for Prescription Drug Benefits, Employer-Sponsored Plans Without High Deductibles, by Benefit Tier, 2023
Exhibit 117: Type of Cost Sharing for Prescription Drug Benefits, Employer-Sponsored Plans with High Deductibles, by Benefit Tier, 2023
Exhibit 118: Average Cost Sharing by Prescription Drug Tier, Employer-Sponsored Plans, 2023
Exhibit 119: Number of Specialty Drug Cost-Sharing Tiers, by Type of Plan Sponsor, 2022
Exhibit 120: Distribution of Coinsurance Structures for Prescription Drug Benefits, Employer-Sponsored Plans, Fourth and Specialty Tiers, 2023
Exhibit 121: Percentage of Covered Workers with No Prescription Drug Coverage Before Annual Deductible, by Plan Type, 2019 vs. 2023
Exhibit 122: Percentage of Covered Workers with Pharmacy Benefit Deductibles, Employer-Sponsored Plans, 2005 to 2023
Exhibit 123: Enrollment in Individual Insurance Market, by Source of Plan, 2015 to 2023
Exhibit 124: Type of Cost Sharing for Prescription Drug Benefits, Silver Health Insurance Marketplace Plans, 2023
Exhibit 125: Average Cost Sharing by Prescription Drug Tier, Silver Health Insurance Marketplace Plans, 2023
Exhibit 126: Presence of Separate Prescription Drug Deductibles in Silver Plans on Health Insurance Marketplaces, 2014 to 2023
Exhibit 127: Medicare Part D Enrollment, by Type of Plan, 2010 to 2023
Exhibit 128: Standard Medicare Prescription Drug Benefit, 2023
Exhibit 129: Type of Cost Sharing for Prescription Drug Benefits, Medicare Part D Plans, 2023
Exhibit 130: Median Cost Sharing by Prescription Drug Tier, Medicare Part D PDPs, 2023
Exhibit 131: Median Cost Sharing by Prescription Drug Tier, Medicare Advantage Plans, 2023
Exhibit 132: Distribution of Coinsurance Rates for Specialty Drugs, Medicare Part D Plans, 2023
Exhibit 133: Median Cost Sharing Amounts for 16 Largest Medicare Part D Plans, 2023
Exhibit 134: Summary of Plan Sponsors’ Tools for Accessing Manufacturer Patient Support Funds to Offset Drug Spending
Exhibit 135: Prevalence of Copayment Offset Programs for Specialty Drugs, 2018 vs. 2023
Exhibit 136: Value of Manufacturer Copayment Offset Programs, 2016 to 2023
Exhibit 137: Share of Prescriptions Using Manufacturer Cost Sharing Assistance for Brand-Name Specialty Drugs, by Therapeutic Class, 2023
Exhibit 138: Distribution of Annual Value of Manufacturer Copay Offset Programs, 2023
Exhibit 139: Commercial Plan Sponsor Views on Specialty Copayment Assistance Programs, 2018 vs. 2022
Exhibit 140: Pharmacist Views on Copayment Assistance Programs, 2020
Exhibit 141: Pharmaceutical Manufacturer Charitable Foundations, by Total Giving, 2022
Exhibit 142: Prescription Economics for Copay Accumulators, Maximizers, and Alternative Funding Programs—Specialty Brand-Name Drug Example
Exhibit 143: Copay Accumulator Adjustment and Copay Maximizers, Prevalence and Use in Commercial Insurance, 2018 to 2023
Exhibit 144: Share of Patients with Copay Accumulator Adjustment and Copay Maximizers Applied to Benefit, by Therapeutic Class, 2019 vs. 2022
Exhibit 145: Total Value of Patient Support Funds Directed to Drug Cost Offset Tools, 2023
Exhibit 146: Use of Alternative Funding Programs (AFPs) in Commercial Insurance, 2021 vs. 2022
Exhibit 147: Consumers’ Out-of-Pocket Spending Share of Outpatient Prescription Drug Expenditures, 1962 to 2022
Exhibit 148: Per Capita Out-of-Pocket Spending on Outpatient Prescription Drugs, 2010 to 2022
Exhibit 149: Average Per-Prescription Patient Out-of-Pocket Costs, by Type of Prescription, 2015 vs. 2022
Exhibit 150: Distribution of Annual Patient Out-of-Pocket Spending, by Type of Health Plan, 2022
Exhibit 151: Share of Employees with Cost Sharing Reduced or Waived for Medications to Treat Chronic Conditions, by Company Size, 2023
Exhibit 152: Products with Cost Sharing Waived in High-Deductible Employer-Sponsored Health Plans, by Medication Class, 2021
Exhibit 153: Type of Cost Sharing for Out-of-Pocket Spending on Brand-Name Prescriptions, 2015 vs. 2023
Exhibit 154: Share of Prescriptions vs. Final Out-of-Pocket Spending, by Type of Cost Sharing and Therapy, 2021
Exhibit 155: Average Out-of-Pocket Spending on Prescription Drugs for Medicare Part D Beneficiaries, by LIS Status, 2007 to 2022
Exhibit 156: Number of Medicare Part D Beneficiaries with Out-of-Pocket Obligations Above the Catastrophic Threshold, 2007 to 2022
Exhibit 157: Highest Average Annual Out-of-Pocket Part D Spending, by Medical Condition, 2021
Exhibit 158: New-to-Product Prescription Abandonment, by Patient Out-of-Pocket Cost, 2022
Exhibit 159: Consumer Understanding of Health Insurance Terms, by Racial/Ethnic Group
Exhibit 160: CVS Health, Quarterly Retail/LTC Prescription Revenues, 2017 to 2023
Exhibit 161: Summary of Pharmacy Benefit Network Design Options
Exhibit 162: Driving Distance to Nearest Retail Pharmacy, by Degree of Urbanization, 2020
Exhibit 163: Medicare Part D PDPs with Preferred Pharmacy Networks, 2011 to 2024
Exhibit 164: Retail Pharmacy Network Size in Medicare Part D Plans, Preferred vs. Total, 2022
Exhibit 165: Medicare Advantage Prescription Drug (MA-PD) Plans with Preferred Pharmacy Networks, by Plan Type, 2024
Exhibit 166: Participation as a Preferred Cost Sharing Pharmacy in Selected Medicare Part D PDPs, by Retail Chain, 2024
Exhibit 167: Enrollment in Medicare Part D PDPs with Preferred Cost Sharing Networks, by Pharmacy Chain, 2022 to 2024
Exhibit 168: Participation as a Preferred Cost Sharing Pharmacy in Selected Medicare Part D PDPs, by PSAO, 2024
Exhibit 169: Share of Employer-Sponsored Plans with a Preferred Retail Pharmacy Network, 2013 to 2023
Exhibit 170: Health Systems’ Requirements for Employee Use of an In-House Pharmacy, 2022
Exhibit 171: Mandatory Mail Pharmacy Utilization for Maintenance Medications, Employer-Sponsored Plans, 2013 to 2023
Exhibit 172: TRICARE, Share of Net Spending on Outpatient Prescriptions, by Dispensing Outlet, 2012 to 2022
Exhibit 173: Payer’s Perceived Lowest-Cost Site of Care for Specialty Dispensing, 2018 vs. 2022
Exhibit 174: Share of Large Employers with Restricted Specialty Pharmacy Network, by Network Size, 2011 to 2023
Exhibit 175: Health Systems’ Requirements for Employee Use of Internal Specialty Pharmacies, 2022
Exhibit 176: White Bagging Approach for Distribution and Reimbursement of Provider-Administered Outpatient Drugs
Exhibit 177: UnitedHealthcare, White Bagging Requirements for Hospital Outpatient Providers, by Specialty Pharmacy, 2024
Exhibit 178: Drug Sourcing for Infused Oncology Therapies, by Practice Type and Source, 2019 vs. 2023
Exhibit 179: Payer Reimbursement and Patient Out-of-Pocket Obligation for Oncology Drugs, White Bagging vs. Buy-and-Bill, 2020
Exhibit 180: Share of Hospitals Permitting Pharmacy Sourcing of Infused Drugs, by Source, 2020 vs. 2022
Exhibit 181: Payer Methodologies for Computing a Pharmacy’s Estimated Acquisition Cost
Exhibit 182: Distribution of Retail Pharmacy Dispensing Fees, 2020
Exhibit 183: Pharmacy AWP Reimbursement and Copayments for Brand-Name Prescriptions, by Dispensing Format, 2023
Exhibit 184: AWP Reimbursement Difference, Retail vs. Mail Pharmacies, 2009 to 2023
Exhibit 185: Plan Sponsor Tactics to Increase Use of 90-day Prescriptions, by Dispensing Channel, 2023
Exhibit 186: AWP Reimbursement and Copayments for Generic Prescriptions, by Dispensing Format, 2023
Exhibit 187: Basis of Retail Pharmacy Reimbursement for Generic Drug Prescriptions, by Method, 2020
Exhibit 188: Pharmacy Reimbursement in Medicaid, Fee-for-Service vs. Managed Medicaid
Exhibit 189: Pharmacy Reimbursement Methodology and Dispensing Fee, Largest Fee-for-Service State Medicaid Programs, 2023
Exhibit 190: Share of Employers Receiving Rebates for Traditional and Specialty Drugs, 2014 vs. 2023
Exhibit 191: PBM Rebate Arrangements for Traditional and Specialty Medications in Employer-Sponsored Plans, 2014 vs. 2023
Exhibit 192: Use of Manufacturers’ Rebate and Other Payments to PBMs, Texas, 2016 to 2022
Exhibit 193: Administrative Fees as a Percentage of WAC, by PBM, 2019
Exhibit 194: Value of Direct and Indirect Remuneration (DIR) in Medicare Part D, 2012 to 2023
Exhibit 195: Medicare Part D, Value of Direct and Indirect Remuneration (DIR), by Source and Type of Drug, 2021
Exhibit 196: Value of Manufacturers’ Coverage Gap Discounts in Medicare Part D, 2014 to 2023
Exhibit 197: Medicaid Program, Gross Prescription Spending and Prescriptions, Fee-for-Service vs. Managed Care, 2022
Exhibit 198: Medicaid, Gross vs. Net Spending on Outpatient Drugs, 2015 to 2022
Exhibit 199: Brand-Name Drugs, Change in Average List and Net Prices, 2014 to 2023
Exhibit 200: Change in List vs. Net Price, by Manufacturer, 2022
Exhibit 201: Average Difference Between List and Net Prices, by Therapeutic Area, 2012 to 2023
Exhibit 202: Total Value of Pharmaceutical Manufacturers’ Gross-to-Net Reductions for All Brand-Name Drugs, 2019 to 2023
Exhibit 203: Components of Pharmaceutical Manufacturers’ Gross-to-Net Gap for All Brand-Name Drugs, by Source, 2023
Exhibit 204: Components of Gross-to-Net Bubble, Brand-Name Insulin Products, 2012 vs. 2022
Exhibit 205: Components of Gross-to-Net Bubble, Johnson & Johnson Innovative Medicines, 2022
Exhibit 206: Application of Pharmacy Benefit Rebates in Employer-Sponsored Healthcare Plans, 2023
Exhibit 207: Prescription Economics for a Third-Party Payer—Traditional Brand-Name Drug Example
Exhibit 208: Prescription Economics for a Third-Party Payer—Traditional Brand-Name Drug Example in a High-Deductible Health Plan
Exhibit 209: Prescription Economics for a Third-Party Payer—Traditional Brand-Name Drug Example in High-Deductible Health Plan with Point-of-Sale Rebates
Exhibit 210: Prescription Economics for a Third-Party Payer—Specialty Brand-Name Drug Example
Exhibit 211: U.S. Drug Distribution and Related Revenues at Big Three Wholesalers, 2023
Exhibit 212: Determination of a Pharmacy’s Brand-Name Drug Acquisition Cost from a Wholesaler
Exhibit 213: Pharmacy Buying Groups and Primary/Preferred Wholesaler Relationships, by Number of Pharmacies, 2023
Exhibit 214: Share of U.S. Generic Purchasing Volume, by Organization, 2023
Exhibit 215: Overall Gross Margins for Chain and Independent Drugstores, 2006 to 2022
Exhibit 216: Total Gross Profits for Chain and Independent Drugstores, 2018 to 2022
Exhibit 217: Overall Gross Margins for Chain and Independent Drugstores, by Company, 2023
Exhibit 218: Prescriptions as a Percentage of Revenues, by Company, 2013 to 2023
Exhibit 219: Components of a Pharmacy’s Cost of Nonspecialty Dispensing, by State
Exhibit 220: Example of Brand-Name Prescription Economics for a Retail Pharmacy
Exhibit 221: Independent Pharmacies, Average Per-Prescription Gross Profits and Margins, 2018 to 2022
Exhibit 222: BrightSpring Health Services, Average Per-Prescription Gross Profits and Margins, 2020 to 2023
Exhibit 223: Top Three PBMs, Sources of Gross Profit, 2023
Exhibit 224: Effect of Brand-Name List Price Increases on a Prescription’s Gross Profit
Exhibit 225: Median Generic Price Relative to Brand Price Before Generic Entry, by Number of Manufacturers
Exhibit 226: Life Cycle of Per-Prescription Gross Profits, Brand vs. Multisource Generic
Exhibit 227: Median AWP Discount for Generic Drugs Sold to Retail Pharmacies, by Number of Manufacturers, 2023
Exhibit 228: Types of Pharmacy Performance Metrics Used by Payers, by Plan Type
Exhibit 229: Net Value of Pharmacy DIR Fees in Medicare Part D, 2012 to 2023
Exhibit 230: 340B Drug Pricing Program, Purchases by Covered Entities, 2015 to 2023
Exhibit 231: Estimated 340B Discounts on Brand-Name Drugs, by Therapeutic Class, 2018
Exhibit 232: 340B Contract Pharmacy Locations, 2010 to 2023
Exhibit 233: 340B Contract Pharmacy Locations and Agreements, by Company, 2023
Exhibit 234: Growth in Value of 340B vs. Non-340B Purchases, by Channel, 2017 to 2022
Exhibit 235: 340B Covered Entities, by Number of Contract Pharmacies, 2023
Exhibit 236: Flow of Funds and Product for a 340B Contract Pharmacy Network
Exhibit 237: 340B Software Vendors with Drug Channel Ownership, 2023
Exhibit 238: 340B Prescription Economics for a Covered Entity, a Contract Pharmacy, and a Patient—Specialty Brand-Name Drug Example
Exhibit 239: Total Gross Profits from 340B Contract Pharmacy, by Company, 2019 to 2023
Exhibit 240: Summary of List Price Reductions for Insulin Products, January 2024
Exhibit 241: Pharmacy Reimbursement and Patient Out-of-Pocket Costs, Low- vs. High-List-Price PCSK9i Products
Exhibit 242: Average Year-over-Year Change in Pricing of Mature Generic Drugs, Oral vs. Injectable, 2015 to 2023
Exhibit 243: Generic Drug Approvals, FDA, 2014 to 2023
Exhibit 244: Actual and Projected Growth Rates in National Health and Outpatient Prescription Drug Expenditures, 2018 to 2028
Exhibit 245: Source of Payment for Outpatient Prescription Drug Expenditures, 2028
Exhibit 246: Number of U.S. Biosimilar Approvals, by Product Type, 2015 to 2023
Exhibit 247: Insulin Glargine, Share of New-to-Brand Prescriptions Written vs. Dispensed, 2023
Exhibit 248: Physician Perceptions of Biosimilars, by Specialty, 2023
Exhibit 249: Top Specialty Therapy Categories, Generic Drugs as a Share of Prescriptions and Net Spending, 2023
Exhibit 250: Nonbiological Specialty Drugs, Pharmacy Acquisition Cost per Unit for Brand-Name vs. Generic Version, 2024
Exhibit 251: Imatinib Mesylate, Medicare Part D Prescription Reimbursement vs. Pharmacy Acquisition Cost, 2017 to 2023
Exhibit 252: Total Brand Revenues Lost to Generic and Biosimilar Launches, by Product Type, 2018 to 2028
Exhibit 253: Pharmacy Industry Prescription Revenues, Traditional vs. Specialty Drugs, 2018 to 2028
Exhibit 254: Vertical Business Relationships Among Insurers, PBMs, Specialty Pharmacies, and Providers, 2024
Exhibit 255: Cigna Healthcare, Number of Specialty Drugs Subject to Site-of-Care Medical Policy, 2018 to 2023
Exhibit 256: Annual Change in Value of 340B Purchases, by Channel, 2018 to 2022
Exhibit 257: Pharmacy Locations Acquired, by Company, 2010 to 2023
Exhibit 258: U.S. Retail Pharmacy Store Count, CVS vs. Walgreens, 2014 to 2023
Exhibit 259: Venture Capital-Backed Digital Pharmacies and Total Funding, 2023
Exhibit 260: Standard Medicare Prescription Drug Benefit, 2024 vs. 2025
Exhibit 261: Products Selected for Medicare Drug Price Negotiation Program, by Total and Out-of-Pocket Spending, 2023
Exhibit 262: Medicare Part D, Share of Liability for Spending, by Source, 2010 to 2025
Back to top